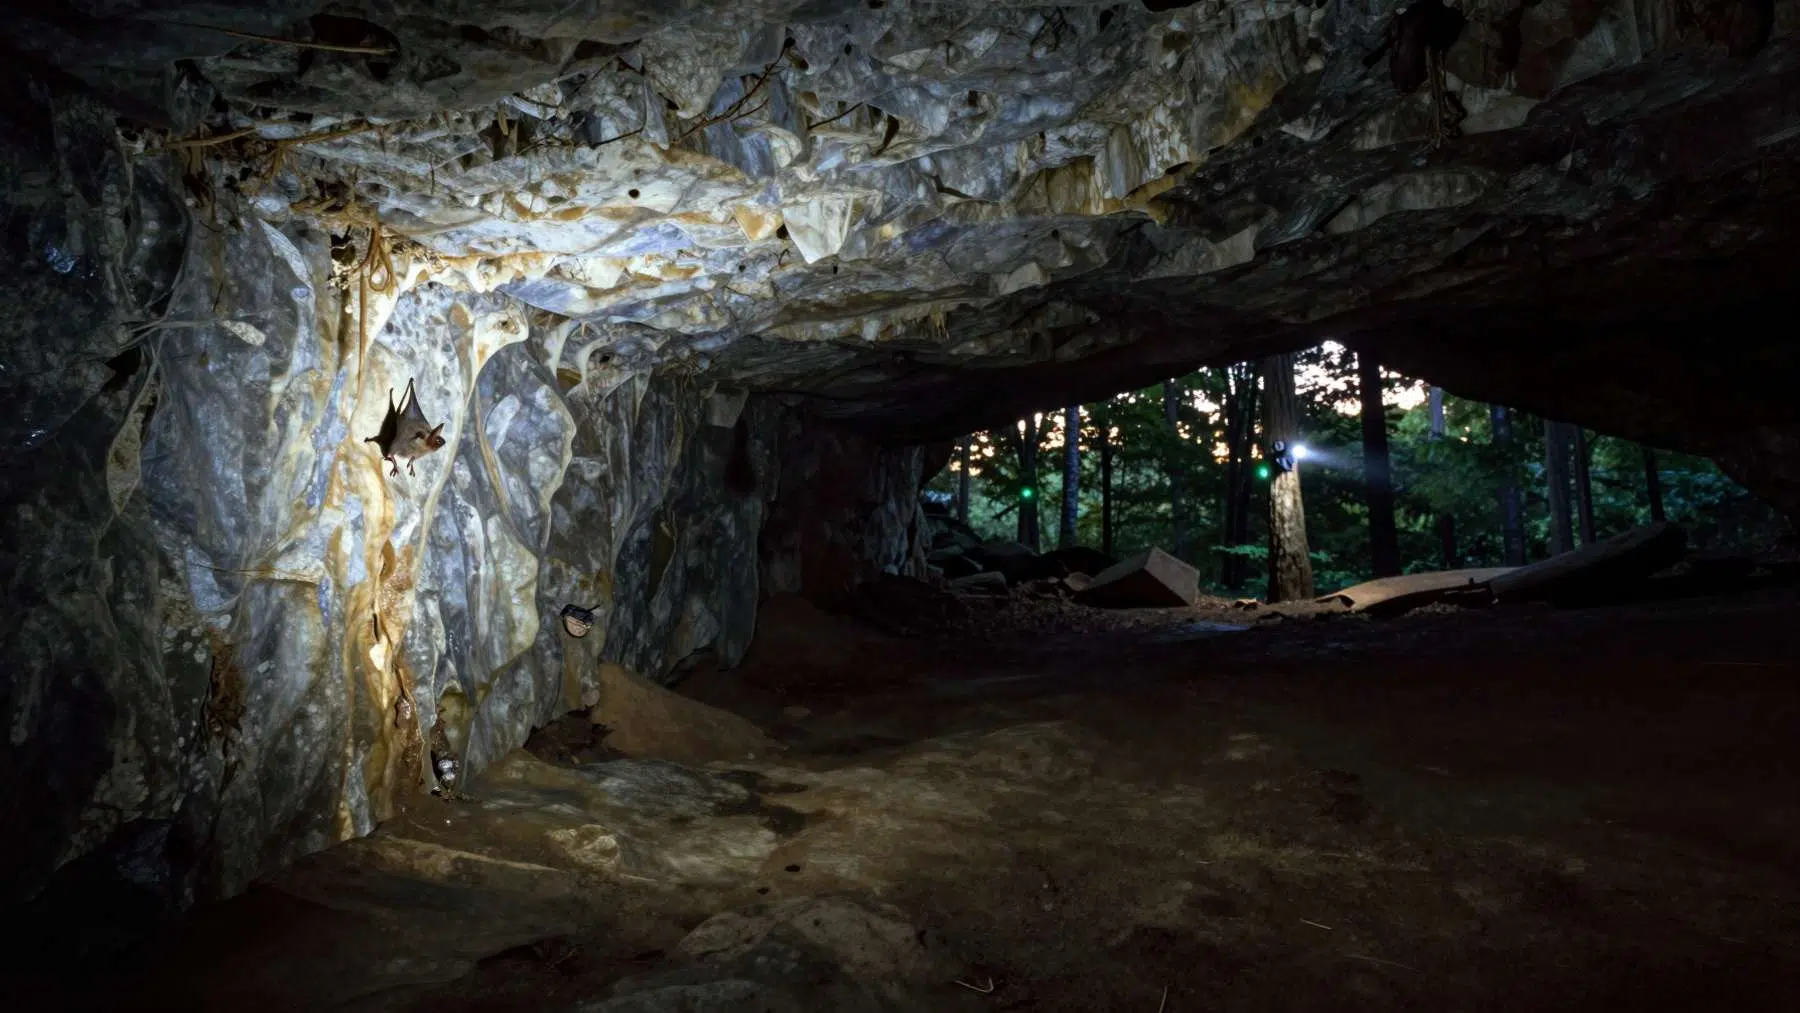
At 69% of known hibernation sites across the eastern United States, northern long-eared bats vanished entirely within four years of White-Nose Syndrome’s arrival — a collapse severe enough to land the species on the federal threatened list in 2014. But when researchers placed acoustic detectors across those same landscapes during summer, the bats kept showing up.
Now scientists are sitting with two datasets that appear to tell opposite stories. Winter cave counts suggest a species in freefall. Summer acoustic surveys suggest something is still out there. Figuring out which picture is closer to the truth — and why they diverge — has become one of the more pressing puzzles in bat conservation.
A disappearing act — or a change of address?
The northern long-eared bat’s federal threatened listing in 2014 was driven by a straightforward signal: winter counts at hibernacula were collapsing. White-Nose Syndrome, caused by the fungus Pseudogymnoascus destructans, was tearing through underground colonies, and the numbers reflected it. At 69% of known hibernacula across the eastern U.S., the species was simply gone within four years of the disease’s arrival.
But “gone from a cave” and “gone from a landscape” don’t mean the same thing.
Summer acoustic surveys — detectors that capture the ultrasonic calls bats use to navigate — kept registering the species in regions where winter counts had flatlined. Two explanations are on the table. One: surviving bats shifted to small, highly dispersed hibernation sites — rock crevices, tree cavities, other non-cave features — that traditional cave surveys simply never find. The other is more sobering: the summer detections may represent only a small remnant of individuals who never hibernated in caves to begin with, a behaviorally distinct subset that was always invisible to winter monitoring. Both hypotheses are plausible, and neither has been ruled out.
Why counting bats in caves only tells half the story
Winter colony counts at known hibernacula have long been the backbone of bat population assessments. They offer a clear window into relative population size — when you can walk into a cave and count clustered bats, you get a concrete number. The problem is that those counts only capture bats using known, accessible underground sites. Colonies are, by definition, a spatially restricted subset of wherever the species actually lives.
Acoustic monitoring fills a different gap. Deploy detectors across a landscape and you can map where a species is present across a wide area. What you can’t do is reliably convert those detections into a headcount — a single bat flying past a detector repeatedly looks different from ten bats flying past once each, and the math to untangle that is genuinely difficult.
The deeper issue is seasonal. Each data source captures only one half of the bat’s annual cycle: winter counts miss everything that happens from spring through fall, while summer acoustics miss hibernation entirely. Used in isolation, either dataset leaves a significant blind spot. In some parts of North America, winter colony count data are sparse enough that even the winter picture is incomplete.
Merging two data streams into one population model
A research team from USGS, Bat Conservation International, and the North American Bat Monitoring Program (NABat) is building something more comprehensive — an integrated full-annual-cycle population model that pulls winter colony counts and summer acoustic detection data into a single analytical framework.
The concept isn’t new to ecology. Bird researchers have been combining data from the North American Breeding Bird Survey with Christmas Bird Counts for years, stitching together seasonal snapshots into coherent population trends. The bat project borrows that logic and adapts it for a different kind of data pairing: colony counts alongside acoustic detection-nondetection records.
One methodological hurdle required a creative fix. The standard integration approach assumes survey sites are visited multiple times within a season, which lets researchers model detection probability — but cave colony counts, historically, happen once per season. The team’s solution is to lean on the acoustic data, collected repeatedly, to satisfy that assumption. Effectively, summer monitoring carries the statistical weight that winter surveys can’t provide on their own. The result will be location- and time-specific estimates of population gain and loss, capturing survival and movement dynamics across the full year.
What the new model could reveal — and why it matters for conservation
If the behavioral-shift hypothesis holds — if bats really have moved to dispersed, hidden hibernation sites in response to WNS — then the apparent population crash recorded in cave counts may significantly overstate actual losses. That would matter considerably. Conservation resources, legal protections, and management priorities are all calibrated to population trend data, and a model that corrects for a systematic blind spot could change how urgently, and in what ways, managers respond.
Even if the news turns out to be worse than summer surveys suggest, the integrated model still delivers something valuable: clarity about which part of the annual cycle is driving population change. Knowing whether bats are dying during hibernation, summer foraging, or migration allows for more targeted interventions rather than broad, resource-intensive responses.
The tools won’t stay locked in a research lab. Results will be made publicly available through NABat’s online reporting platform, and the statistical methods will be released as an extension of the NABat R-package — putting the analysis directly in the hands of wildlife managers across North America.
That’s the next thing to watch. As the model is applied to real monitoring data and outputs become accessible to managers, the northern long-eared bat may turn out to be a test case for how conservation science handles contradictory signals — and whether better data integration can sharpen decisions before a species runs out of time.
Read the whole thing?
Get the week's signal, not the noise
Our sharpest reporting on energy, climate and nature — free, once a week.